
Are you following your ticket backlog? Your people are busy, but are they keeping up with the work or are they keeping busy only by eating up the backlog? The answer to these questions may drive staffing decisions. Our newest report helps you keep track of how your backlog is changing.
Ticket Backlog – Under The Efficiencies Tab
A few weeks ago, we released our staffing utilization report to highlight how many FTEs were need to do the work in a given month. Based on feedback from our users, we went a level deeper. Staffing can be judged not just by the work that is getting done, which you can see in the Staffing Utilization report, but also by how your backlog is changing by board
Click to Enlarge
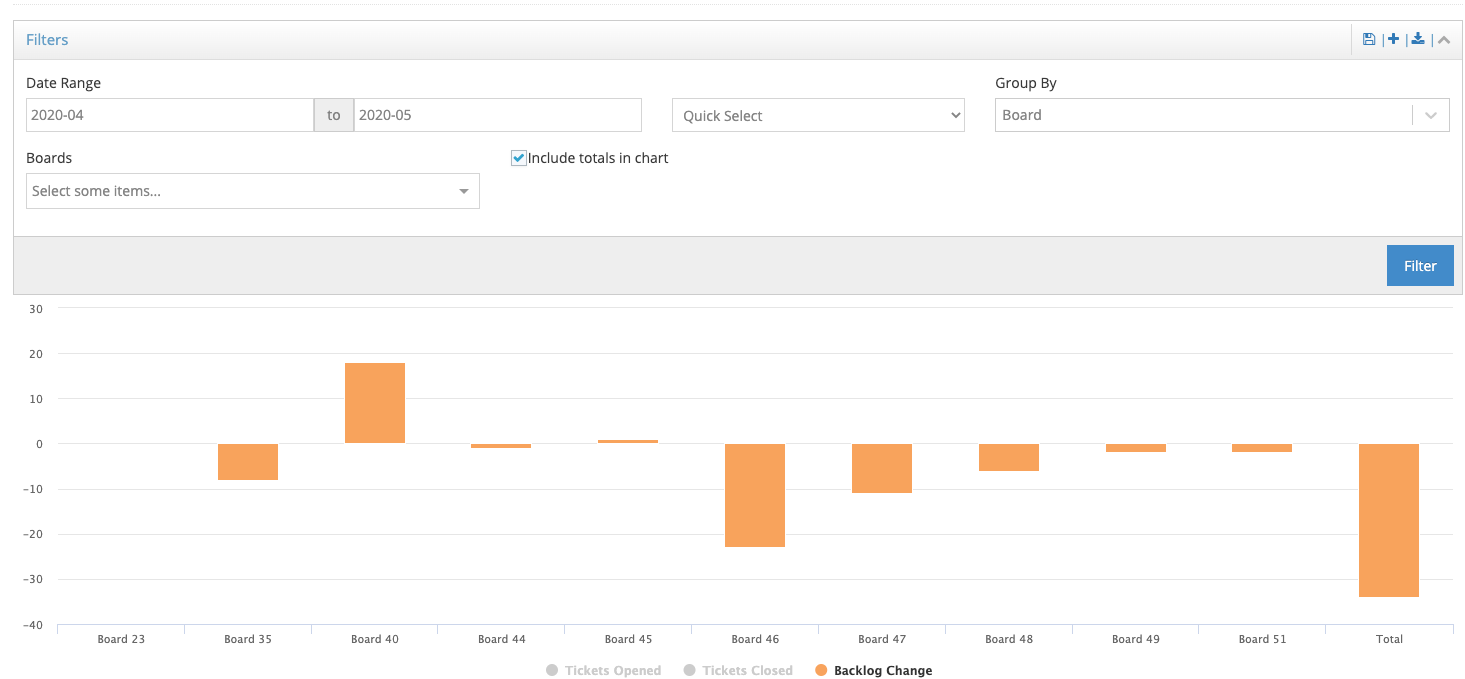
For example in the chart above, we can see that in April and May, Board 46 saw a backlog decline by 22 tickets. While reducing a backlog is a good thing, you may feel that the board is slightly overstaffed. Filling up hours by burning through the backlog is not sustainable long term. Alternatively, you might feel that Board 40 is understaffed as the backlog was growing.
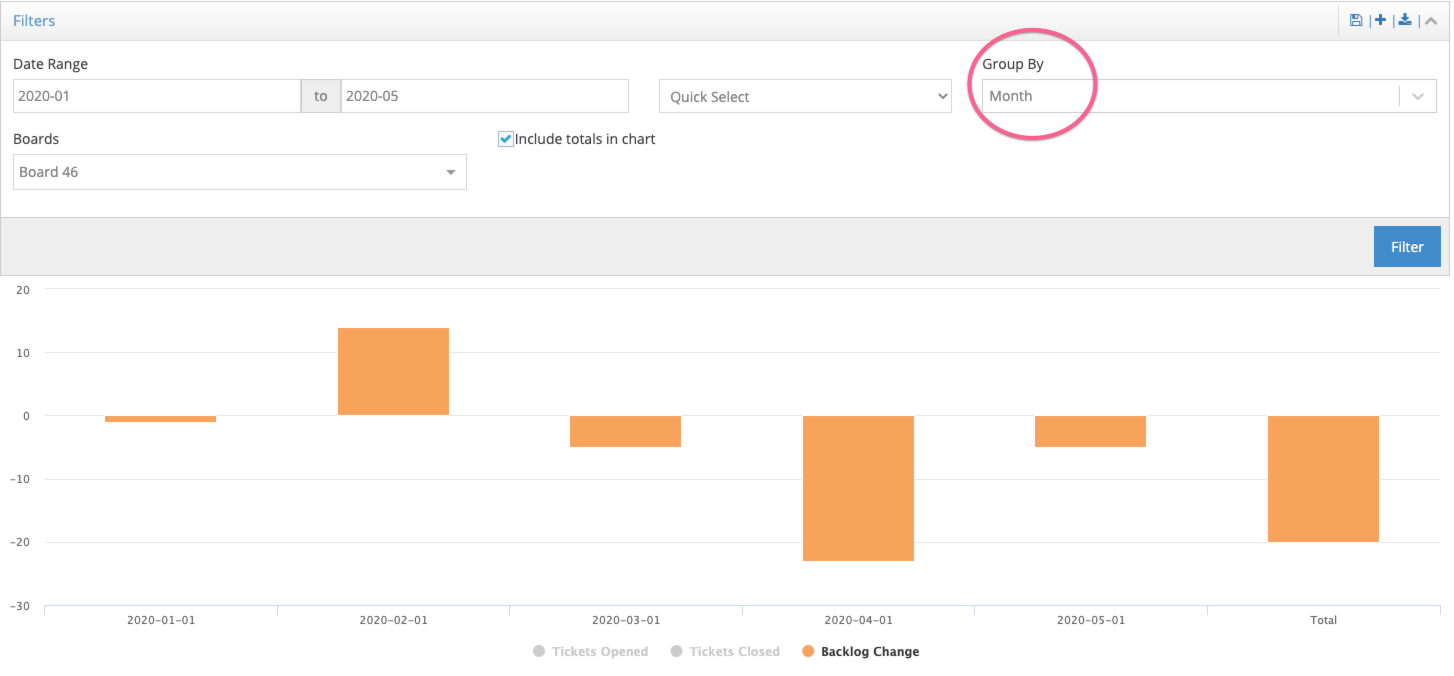
Another way to look at it would be to see one or more boards over time to see how the backlog has ebbed and flowed over the months. On the same report, you can simply choose to group the data by month, rather than by board.
Ticket Backlog Sort by Time
Click to Enlarge
Important note: To avoid a lot of noise created by tickets that are automatically closed, we do not include tickets without time on them. So there may be some open tickets, usually in the current month, that do not show as open if they have not been worked on yet. We went back and forth on how to present this and the cleanest option was to only include the ticket if it has your people’s time against it.
This report, as well as most of our newer reports, came from direct feedback of our partner base. We are very thankful to our community for helping us continue to make MSPCFO more useful in successfully driving businesses forward.
The report is available for Premium and Enterprise subscriptions at the Admin and Manager level.
Stay safe & healthy.